
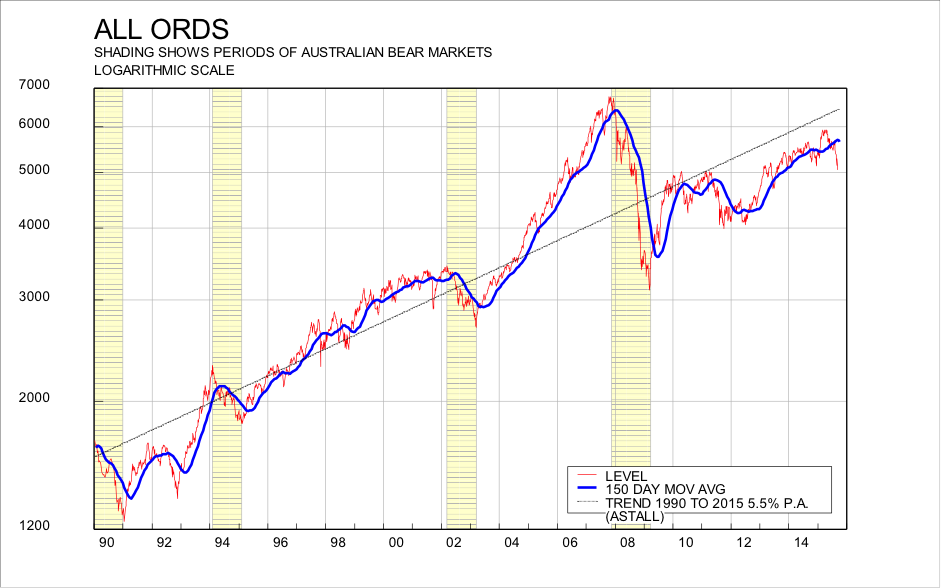
When the share market is volatile in the short term, many people forget the long-term benefits of share investment. The chart below shows the All Ordinaries Index from January 1990 to now, plotted on a log scale. A logarithmic scale is designed to make similar percentage moves in the market occupy the same “space” on the chart. So for example, a 10% move when the market was at 1200 in 1990 is just 120 points, whereas a 10% move when the market is 6000 is 600 points. On a log-scale chart, these moves are equal.
 There are a few key things to take away from this chart:
We last looked at the case for long-term share investment here, and our thoughts on the current correction can be read here.
Ultimately, share prices are driven by company earnings (profits) and their rise. Although total earnings for the All Ordinaries Index fell 2% in the year to June 2015, this was entirely because of a 35% fall in the earnings of resources companies. Earnings for the rest of the market rose 7.5%, and earnings for all shares excluding financials and resources rose closer to 12%. There is a big skew in the overall share market, with some companies, especially those receiving income from overseas, doing well, while resources and banks struggle. Resources are roughly 10% of the index by market capitalisation; banks make up 25%. It doesn’t seem very likely that resources profits will make a cyclical recovery any time soon, but banks at some point will show (moderate) earnings growth, and will start to seem very attractive, particularly if it becomes likely that the RBA will cut the cash rate again.
We have not changed our mind about the shorter-term and longer-term outlook for shares. We think that even if the share market hasn’t quite bottomed, it is close to doing so, and that longer term, shares are an excellent investment. The current weakness in the market makes them an even better prospect. This is especially true if the shares you are invested in have been chosen judiciously.


